Top 5 Personal Finance Takeaways for 2025
📉 A third of Americans still carry more debt than savings.
High-interest debt continues to outpace emergency preparedness, leaving millions financially exposed. Prioritizing debt payoff before lifestyle upgrades remains the fastest route to stability.
🏦 Fewer than 40% have a written financial plan.
Planning is the ultimate differentiator. Even a one-page roadmap outlining goals, debt strategy, and savings targets dramatically improves outcomes.
💳 Credit-card APRs are at record highs.
With average rates above 22%, credit has become an expensive habit. Shifting toward debit-based spending and debt reduction is essential for financial health.
💰 Retirement savings remain uneven across generations.
Despite awareness campaigns, participation gaps persist. Younger adults are starting earlier but contributing less, while Gen X and Boomers face rising longevity costs.
🧠 Financial literacy and emotional money health are key differentiators.
Those who combine financial knowledge with emotional control — resisting impulse spending, understanding behavioral biases — are best positioned to thrive in uncertain times.
1. Introduction — America’s Financial Check-Up for 2025
Why Financial Statistics Matter for Households and Policymakers
Every year’s financial data tells a story—not just about the economy, but about how Americans are living, spending, and saving. In 2025, this story is one of resilience under pressure. With inflation moderating but prices still high, households continue to juggle competing priorities: rebuilding savings, paying down debt, and trying to plan for a future that feels uncertain.
For households, these numbers reveal how effectively families are protecting themselves against unexpected costs and whether long-term goals like retirement are within reach. For policymakers, they serve as a roadmap—showing where the safety net succeeds and where financial vulnerability persists.
Understanding these statistics helps individuals benchmark their own situation against national trends, identify areas of improvement, and take actionable steps toward financial stability.
Key Shifts from 2024 to 2025
Compared to 2024, several clear shifts have emerged in the data:
- Savings rates have stabilized after the post-pandemic decline, but many Americans are still one unexpected bill away from hardship.
- Credit-card balances and APRs have reached record highs as interest rates remain elevated.
- Student loan repayments resumed, straining household budgets and reversing some gains made during the pause.
- Workplace financial wellness programs have expanded, reflecting employer recognition that money stress directly affects productivity.
- Generational divides have deepened—Gen Z shows higher financial literacy and use of budgeting apps, while Gen X faces mounting mid-life financial pressure.
Taken together, 2025 marks a transitional year: one where financial awareness is rising, but structural stressors—from high living costs to uneven wage growth—continue to test household resilience.
2. Emergency Savings and Financial Safety Nets
2.1 How Many Americans Can Cover a $1,000 Emergency
Despite growing awareness, only about 43% of Americans could cover a $1,000 emergency expense from savings in 2025, according to recent surveys from Bankrate and the Federal Reserve. The remaining majority would need to borrow, use credit cards, or delay payment—highlighting an ongoing fragility in household finances.
Younger adults and lower-income households remain the most exposed. For many, even modest emergencies—like car repairs or medical bills—can lead to debt cycles that are hard to escape.
Financial planners generally recommend keeping at least three to six months of essential expenses in a liquid emergency fund, but as inflation persists, reaching that goal feels increasingly out of reach for millions.
2.2 The Rise of “Savings Fatigue” After Inflation Shocks
After three years of economic volatility, many Americans are experiencing what experts call savings fatigue. Persistent price increases in housing, groceries, and utilities have forced families to draw down reserves just to maintain their standard of living.
In 2025, the average household savings rate hovers around 4.5%, well below the pre-pandemic norm of 7–8%. Behavioral economists point out that this fatigue isn’t just about money—it’s psychological. When progress feels impossible, people disengage from budgeting and saving altogether.
Encouragingly, fintech tools and automation are helping some households fight back. Automatic savings transfers and “round-up” investing apps are making it easier to rebuild buffers gradually, even when motivation wanes.
2.3 Who’s Most at Risk of Financial Shortfalls
Data from the Federal Reserve’s Economic Well-Being of U.S. Households report shows that risk is unevenly distributed:
- Renters are more than twice as likely as homeowners to lack emergency savings.
- Single-parent households face higher exposure to financial shocks.
- Gig workers and freelancers—who often lack employer-based benefits—report the greatest income volatility and lowest savings cushions.
- Younger adults (ages 18–29) are saving less than older generations at the same age, largely due to student debt and housing costs.
These patterns underscore the importance of targeted financial education and access to flexible savings tools that meet people where they are.
3. Debt and Credit Health in 2025
3.1 Credit-Card Balances and Interest Rate Pressure
In early 2025, U.S. credit-card debt surpassed $1.3 trillion, a new record. The average interest rate on revolving credit hit 22.8%, the highest in four decades.
High APRs mean that even small balances can balloon quickly. A household carrying $5,000 in revolving credit at today’s rates could pay over $1,000 per year in interest alone if only minimum payments are made.
Financial advisors increasingly urge consumers to adopt “avalanche” or “snowball” payoff strategies—and to explore balance-transfer cards or personal loans with fixed rates when appropriate.
3.2 Student Loans: Post-Pause Reality Check
After more than three years of relief, student loan payments officially resumed in late 2024, and by 2025 the impact is clear: budgets are tightening again.
Roughly 60% of borrowers report difficulty adjusting to repayment, and delinquencies have begun to tick upward. Many borrowers are exploring income-driven repayment (IDR) plans, while others are refinancing or extending terms to regain stability.
Long term, this resumption has re-highlighted the role of student debt in delaying milestones like homeownership, retirement saving, and family formation.
3.3 Auto Loans, BNPL, and Hidden Household Debt
Beyond traditional loans, Americans are taking on new forms of debt that don’t always appear in standard reports:
- Auto loan balances now exceed $1.6 trillion, with average monthly payments nearing $750—a record high.
- Buy Now, Pay Later (BNPL) programs have surged in popularity, especially among Gen Z and Millennials. While they offer flexibility, they can mask cumulative debt exposure when multiple accounts are used simultaneously.
- Personal loans and fintech credit lines have expanded access to borrowing, but with varying transparency around fees and interest.
Together, these “invisible” liabilities make it harder for households to accurately gauge their debt load—and for policymakers to measure systemic risk.
4. Budgeting and Spending Behaviors
4.1 How Many Americans Track Their Money
Tracking where money goes remains one of the simplest, yet least-practiced, financial habits. In 2025, only 42% of Americans actively track their income and expenses, according to research from the National Foundation for Credit Counseling (NFCC).
However, those who do tend to experience significantly better financial outcomes: higher savings rates, lower credit utilization, and greater confidence in managing bills.
Interestingly, Gen Z leads all generations in digital tracking, with over 60% using apps or spreadsheets to monitor cash flow—compared to just 35% of Boomers. This signals a growing cultural shift: younger earners view money tracking not as restriction, but as empowerment.
4.2 Average Monthly Savings Rate and Spending Breakdown
The average personal savings rate in 2025 is 4.5%, up slightly from the previous year but still well below long-term historical averages. Many households report feeling “stuck”—saving small amounts inconsistently due to persistent cost pressures.
Spending data shows that the largest household expenses remain consistent across income groups:
| Category | Average % of Monthly Income (2025) |
|---|---|
| Housing & Utilities | 34% |
| Transportation | 16% |
| Food & Groceries | 13% |
| Debt Payments (credit cards, loans) | 12% |
| Insurance & Healthcare | 9% |
| Savings & Investments | 4–5% |
| Discretionary (entertainment, travel, etc.) | 7–8% |
Households that pre-plan and automate their savings—transferring funds before discretionary spending—show markedly better outcomes. The key isn’t perfection; it’s consistency.
4.3 Popular Budgeting Tools and Digital Habits
In 2025, the personal finance landscape is increasingly digital-first. The most popular tools for everyday money management include:
- Mint and Empower (formerly Personal Capital): Comprehensive dashboards for budgeting and investments.
- You Need A Budget (YNAB): Focused on zero-based budgeting and intentional spending.
- EveryDollar: Popular among debt-free households using envelope-style systems.
- Banking apps with built-in tracking (Chase, Capital One, Ally): now used by over 50% of app-based budgeters.
Additionally, AI-assisted budgeting tools are on the rise, automatically categorizing spending and projecting future bills. This shift signals a broader movement toward proactive, data-driven financial management, where real-time insights replace static spreadsheets.
5. Retirement Readiness and Long-Term Outlook
5.1 Percentage of Americans with Retirement Accounts
According to the 2025 Federal Reserve Survey of Consumer Finances, about 57% of U.S. adults hold some form of retirement account, including 401(k)s, IRAs, or similar plans. That figure is largely unchanged from 2024—suggesting progress has plateaued.
Yet participation isn’t the main problem; account balances are. The median 401(k) balance for ages 55–64 stands near $108,000, translating to roughly $400 per month in potential retirement income—well below what’s needed for financial independence.
Meanwhile, 25% of adults report having no retirement savings at all, a sobering indicator of ongoing wealth inequality.
5.2 Contribution Gaps and Generational Disparities
The data reveals clear generational divides:
- Gen Z (18–27): 35% participate in employer plans; median savings ~$9,500.
- Millennials (28–43): 66% participate; median ~$43,000.
- Gen X (44–59): 75% participate; median ~$97,000.
- Boomers (60–75): 70% have retirement accounts; median ~$170,000.
While participation improves with age, contribution rates have stagnated. Many workers contribute only the employer match—typically 3–5%—well below the recommended 10–15% of income for long-term success.
5.3 The Impact of Inflation and Longer Lifespans
Retirement planning is becoming a moving target. Even with inflation slowing, the cost of living in retirement is up 18% compared to 2019 levels. Housing, medical care, and food costs are the biggest culprits.
At the same time, life expectancy is rebounding, with many Americans now planning for 25–30 years in retirement. This combination—rising costs and longer lives—means savers must plan for more years of spending with assets that may not grow as quickly in a higher-interest-rate environment.
Financial planners increasingly emphasize diversified income sources, including Roth accounts for tax flexibility and delayed Social Security strategies to maximize guaranteed benefits.
6. Financial Stress and Workplace Well-Being
6.1 How Money Worries Affect Mental Health and Productivity
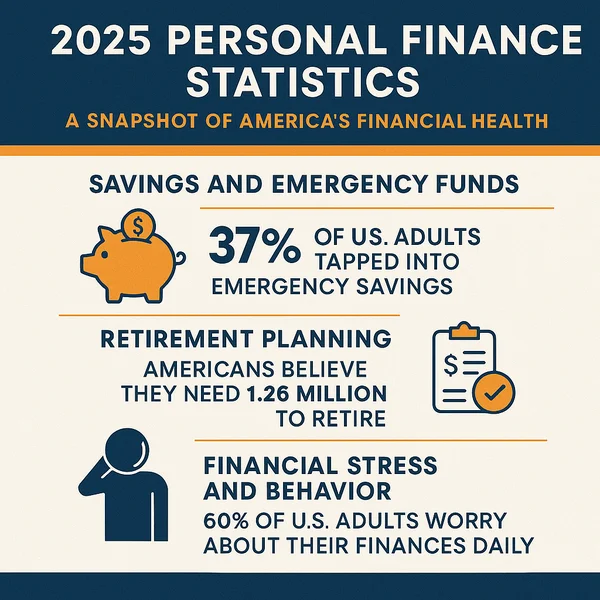
Financial anxiety remains one of the most pervasive forms of stress in 2025. Surveys show that 61% of adults report feeling daily stress about money, and 45% say financial concerns negatively affect their mental health.
In workplaces, the connection is direct: financially stressed employees are twice as likely to miss work and less productive by up to 15%, according to PwC’s Employee Financial Wellness Survey.
The emotional burden often shows up as burnout, distraction, and disengagement—symptoms that ripple through both personal and professional life.
6.2 Employer-Sponsored Financial Wellness Programs
Employers have taken note. In 2025, over 70% of large companies offer some form of financial wellness benefit, such as:
- Retirement contribution matching and auto-enrollment
- Student loan repayment assistance
- On-site or virtual financial coaching
- Emergency savings payroll programs
These benefits are more than perks—they’re strategic investments in employee stability and retention. Studies show that companies offering financial wellness programs experience 23% lower turnover and higher employee satisfaction scores.
6.3 Top Financial Stressors for 2025
The top drivers of financial stress in 2025 reflect both macroeconomic and personal factors:
| Rank | Primary Stressor | % of Adults Affected |
|---|---|---|
| 1 | Rising cost of living | 74% |
| 2 | Credit-card debt and high interest rates | 62% |
| 3 | Lack of emergency savings | 57% |
| 4 | Housing affordability | 51% |
| 5 | Student loans resuming | 44% |
These stressors compound—those struggling with one often experience several simultaneously. Experts emphasize that small wins, such as paying down high-interest debt or building a one-month savings buffer, can significantly improve both financial and emotional well-being.
7. Generational Financial Gaps and Mindsets
Generational differences shape how Americans think about money, debt, and opportunity. In 2025, those gaps are widening — not just in assets, but in confidence, access, and outlook.
7.1 Gen Z: Starting Strong but Anxious
Gen Z adults (ages 18–27) are entering adulthood more financially aware than any generation before them. Roughly 68% use budgeting apps, and nearly 40% invest through digital platforms like Robinhood or Fidelity Spire. They are also more likely to discuss money openly, normalize side hustles, and prioritize mental health over material consumption.
Yet, their optimism coexists with anxiety.
- 52% say they “often feel behind financially.”
- Student debt and housing affordability remain the biggest roadblocks.
- Many cite difficulty distinguishing between social media “finance influencers” and credible advice.
Gen Z’s mindset is entrepreneurial, tech-driven, and socially conscious — but sustained financial success will depend on grounding that enthusiasm in consistent, long-term habits.
7.2 Millennials: Juggling Debt, Kids, and Housing Costs
Millennials (ages 28–43) are in the thick of life’s most expensive decade — raising children, buying homes, and managing careers amid record housing prices. Despite being the most educated generation, they carry the highest debt-to-income ratios in the country.
Key stats from 2025 data:
- Average millennial household debt: $141,000
- Average home price-to-income ratio: 7.5× (up from 4.0× in 2000)
- Childcare costs: Exceed $11,000 annually on average
Still, this generation is showing strong financial recovery behaviors:
- 72% contribute to a retirement plan (up from 63% in 2022).
- 58% report maintaining a household budget.
- 41% are saving for their children’s education.
Millennials’ challenge is balancing multiple goals simultaneously — paying off debt while building equity and preparing for the future. Their success may depend less on income and more on strategic prioritization.
7.3 Gen X: Squeezed by Aging Parents and College-Bound Kids
Often called the “sandwich generation,” Gen Xers (ages 44–59) are caring for both children and aging parents — with little institutional support. Roughly 47% provide financial help to family members in two generations, while still saving for their own retirement.
Their top concerns in 2025:
- Rising healthcare and long-term care costs
- College expenses for dependents
- Delayed retirement due to inflation and caregiving costs
While Gen X holds 31% of national wealth, many feel underprepared for retirement. Half report having less than $100,000 saved, and only 1 in 4 has a written financial plan. Yet, this generation also possesses a pragmatic mindset — they value stability and tend to be disciplined savers once a plan is in place.
7.4 Boomers: Managing Longevity Risk and Rising Expenses
Baby Boomers (ages 60–78) control over 50% of all U.S. household wealth, but face mounting financial challenges tied to longevity. Longer life expectancies and healthcare inflation are eroding fixed incomes.
Notable 2025 insights:
- The average retiree spends $4,345 per month, up 22% from 2020.
- 44% of retirees worry they will outlive their savings.
- Rising Medicare premiums and property taxes are cutting into disposable income.
Boomers’ priorities are shifting from wealth accumulation to wealth preservation and income sustainability. Many are exploring annuities, downsizing, and delayed Social Security to stretch resources further — strategies that reflect both caution and experience.
8. Gender and Racial Disparities in Financial Health
8.1 The Wealth Gap by Gender and Race
Despite decades of progress, significant financial inequities persist. In 2025, women hold roughly 70 cents in wealth for every dollar held by men, according to the U.S. Census Bureau and Federal Reserve data. This gap widens dramatically among women of color:
- Black women: 35 cents per dollar
- Latina women: 33 cents per dollar
Meanwhile, racial wealth gaps remain striking. Median net worth data reveals:
- White households: $285,000
- Hispanic households: $61,000
- Black households: $44,000
Contributing factors include pay inequities, lower access to employer retirement plans, credit barriers, and historic underinvestment in minority communities.
However, participation in digital banking, micro-investing, and small business ownership is rising fastest among women and minority households — suggesting a gradual closing of opportunity gaps.
8.2 Closing the Gap Through Education and Access
The most promising equalizers are financial education, equitable access to credit, and entrepreneurship support. Programs that pair literacy training with practical financial tools show measurable results:
- Participants in long-term financial coaching programs improve savings rates by 33% within one year.
- Access to small business microloans boosts local median incomes by up to 9% in underserved communities.
- Women-led investment networks and peer mentorships have significantly increased female participation in wealth-building activities.
Closing the wealth gap is not just a matter of fairness — it’s a key driver of broader economic growth. When more Americans build financial stability, communities thrive.
9. The New Financial Landscape — Inflation, Rates, and Policy Shifts
2025 marks a complex financial environment: inflation is easing, but costs remain elevated; interest rates are high but stabilizing; and policy responses are redefining financial planning priorities.
9.1 Federal Reserve Trends and Consumer Impact
The Federal Reserve entered 2025 maintaining rates around 4.75–5.00%, prioritizing inflation control over rapid cuts. While cooling price growth, these higher rates have kept borrowing expensive — affecting mortgages, auto loans, and credit cards.
Consumers feel the squeeze:
- Mortgage rates hover near 6.7%, up from historic lows under 3% in 2021.
- Credit-card APRs exceed 22%.
- Small business loans average 9–11%, slowing expansion plans.
Yet, for savers, this environment offers opportunity. High-yield savings accounts and CDs now provide returns above 5%, incentivizing households to rebuild liquidity. The Fed’s steady stance has ushered in what economists call a “new normal” — an era of persistent but manageable inflation.
9.2 Cost-of-Living Increases and Real Income Challenges
Even as inflation moderates to roughly 2.9% year-over-year, prices for essentials remain elevated. Housing, insurance, and utilities are the main culprits behind ongoing household strain.
Real wages have grown modestly — about 1.2% adjusted for inflation — but that improvement hasn’t fully offset cost pressures. The median household income in 2025 is approximately $79,200, yet purchasing power remains below 2019 levels.
This “cost-of-living lag” means many households are working harder just to maintain the same lifestyle. It’s driving higher demand for side incomes, remote work, and financial coaching — as Americans seek stability in an economy that feels perpetually expensive.
9.3 Policy Responses and Financial Literacy Initiatives
In response to rising economic insecurity, both public and private sectors have expanded efforts to strengthen financial literacy and access:
- Federal and state initiatives are promoting financial education mandates in schools, now adopted in 30+ states.
- Tax incentives for retirement savings and small business startups continue under provisions of the SECURE 2.0 Act.
- Consumer protection updates from the CFPB are targeting hidden fees in credit products and BNPL services.
Financial institutions are also integrating educational tools directly into apps, making literacy more accessible than ever. Still, experts warn that awareness must be paired with accountability — without consistent application, even the best information can’t close the wealth gap.
10. Financial Lessons from the 2025 Data
10.1 What These Statistics Mean for Your Financial Plan
The 2025 data reveals both a warning and an opportunity. Americans are more financially aware than ever, but awareness hasn’t fully translated into action. High credit-card balances, limited emergency funds, and uneven retirement readiness all point to a need for stronger personal planning systems.
The good news? Financial improvement doesn’t require perfect timing or wealth — it requires clarity, structure, and discipline. The same data showing widespread stress also highlights what works:
- Written financial plans correlate with higher savings, better debt management, and greater long-term stability.
- Automated behaviors — such as recurring transfers or retirement contributions — consistently outperform manual, emotion-driven decisions.
- Diversification of income through side hustles, freelancing, or passive income streams is becoming a defining trait of financial resilience in 2025.
For individuals and families, the takeaway is simple: you can’t control macroeconomics, but you can control your cash flow, savings habits, and financial education. Those micro-decisions compound — quietly, but powerfully.
10.2 Small, Consistent Habits That Move the Needle
The difference between those thriving and those struggling isn’t luck — it’s consistency. Financial growth in 2025 is about managing systems, not moments. The following small habits, when sustained, create meaningful impact:
- Track spending weekly. Awareness precedes improvement.
- Automate your savings and bill payments. Remove emotion from the equation.
- Revisit your budget quarterly. Adjust as your income, expenses, and goals evolve.
- Invest regularly, even in small amounts. Compound interest rewards time, not timing.
- Review your credit report annually. Prevent small errors from becoming large setbacks.
- Reassess insurance and retirement contributions yearly. Protect and grow simultaneously.
These may sound simple, but they form the backbone of every solid financial foundation. As 2025’s numbers show, those who stay engaged and intentional — rather than reactive — achieve far better results over time.
11. Conclusion — Building a More Resilient Financial Future
Turning Data Into Direction: How to Act on What You’ve Learned
The numbers tell a clear story: America’s financial foundation is improving, but unevenly. Inflation, debt, and uncertainty continue to test households — yet within those challenges lie real opportunities to rebuild smarter.
Start with the basics:
- Create or update your written financial plan.
- Set automated transfers toward both savings and debt reduction.
- Reassess insurance, taxes, and retirement annually.
- Keep learning — financial literacy isn’t a destination; it’s a lifelong advantage.
Every data point in this report represents a real household striving to do better. By applying these lessons, you’re not just reacting to the economy — you’re shaping your own financial story.
Related Guides and Next Reads on Jason’s Fin Tips
- 📊 Under 30 and Working? Here’s How the One Big Beautiful Bill Could Shrink Your Real Income
- 💡 Essential Financial Terms Every Beginner Must Know
- 🧾 Taxes for Beginners: A Simple Guide to Understanding How Taxes Work
- 🔍 How to Track Monthly Expenses Easily
Back to Building Wealth Strategies and Wealth Accumulation
Check out Wealth and Financial Independence Hub
Check out our Financial Planning Roadmap and more.